What could you do to unlock the potential of six million automotive news articles? Together with the rest of the NewsReader consortium, SynerScope will organize two hackathons where you can showcase your skills. The hackathons will take place the 21st and the 30th of January in Amsterdam and London respectively.
Participating hackers will be able to explore data extracted from more than six million news articles relating to the global automotive industry. These news articles have been processed in the state-of-the-art linguistic processing pipeline developed by the NewsReader project. The result is an enormous dataset of events, describing who did what with whom, where, and when. Participants will not only have the opportunity to develop their own ideas, but will also get the chance to dive into the data with SynerScope’s active discovery suite.
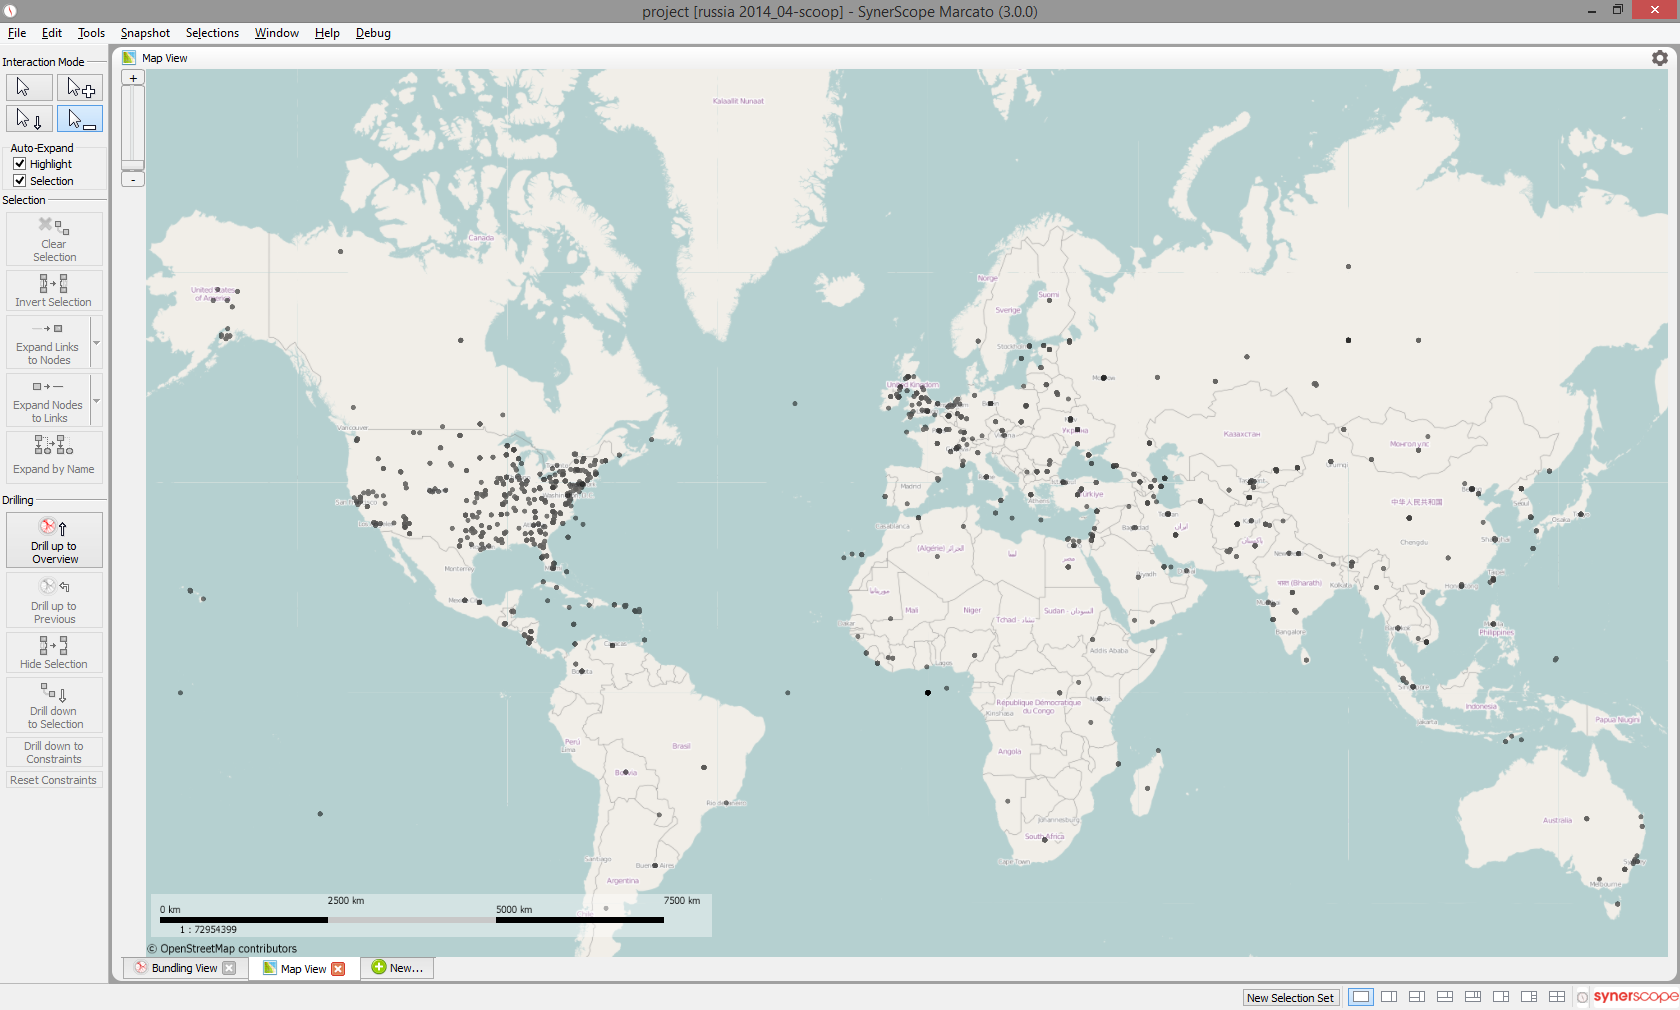
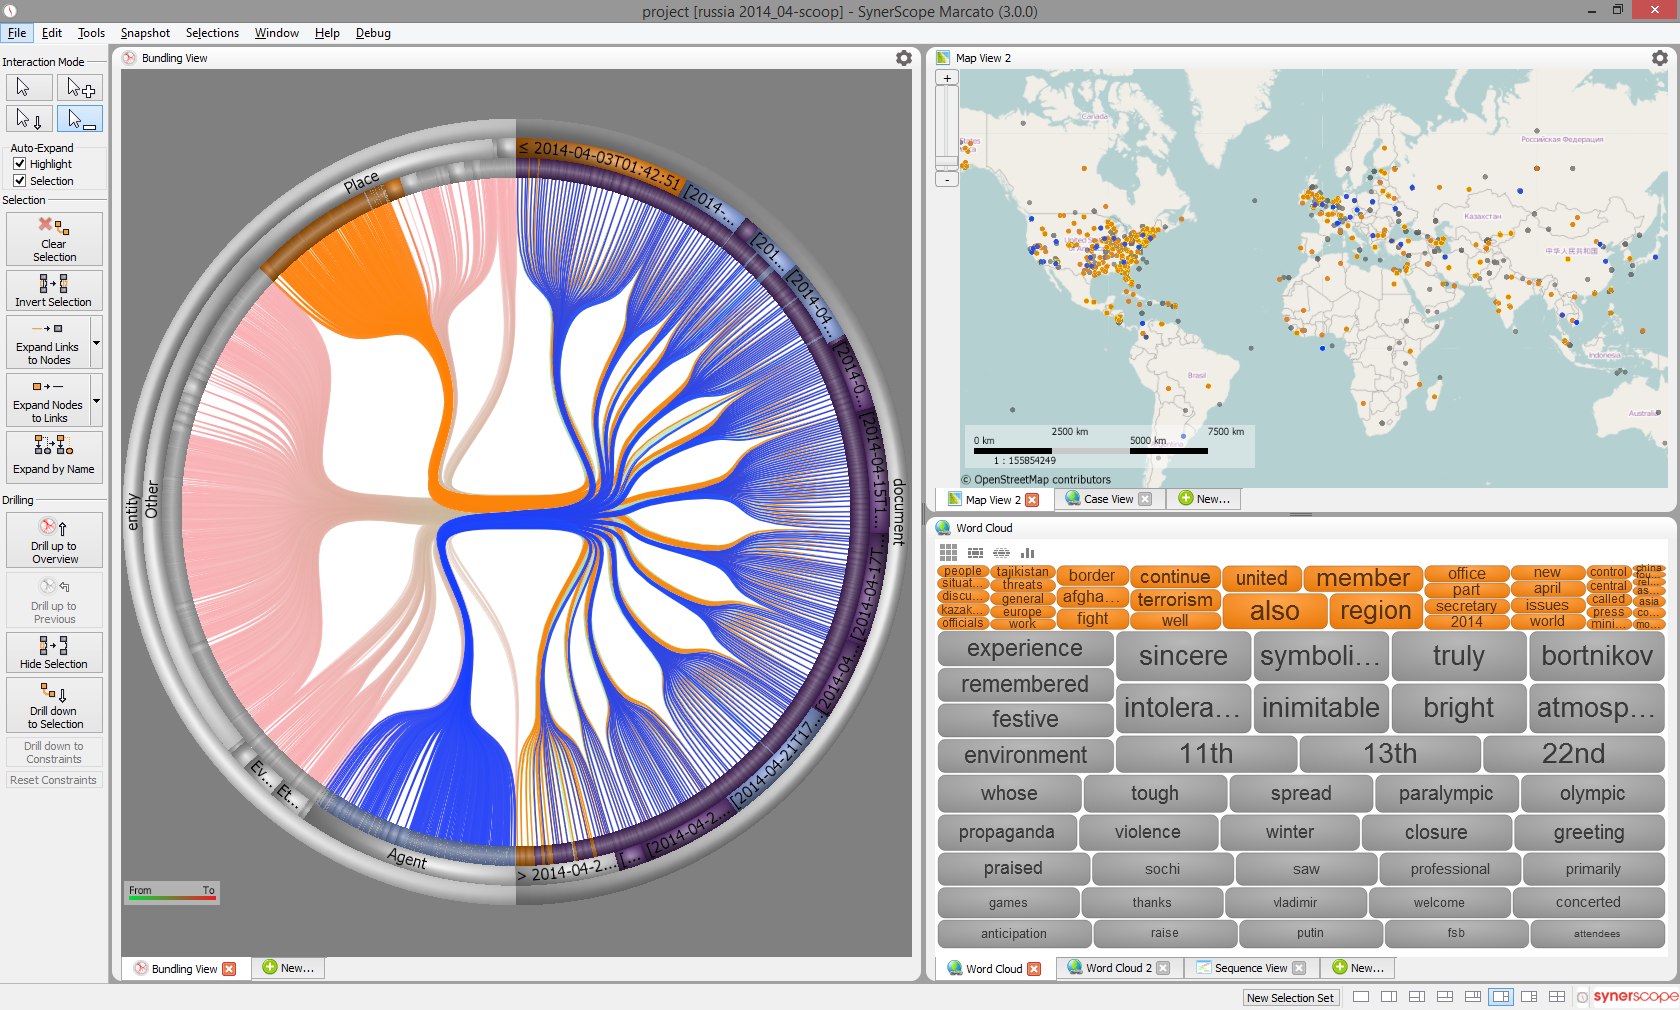
Using the suite, it is possible to visualize all dimensions of the NewsReader data: The network of interactions between people and organizations, where these interactions took place geographically, and how this network evolved over time.
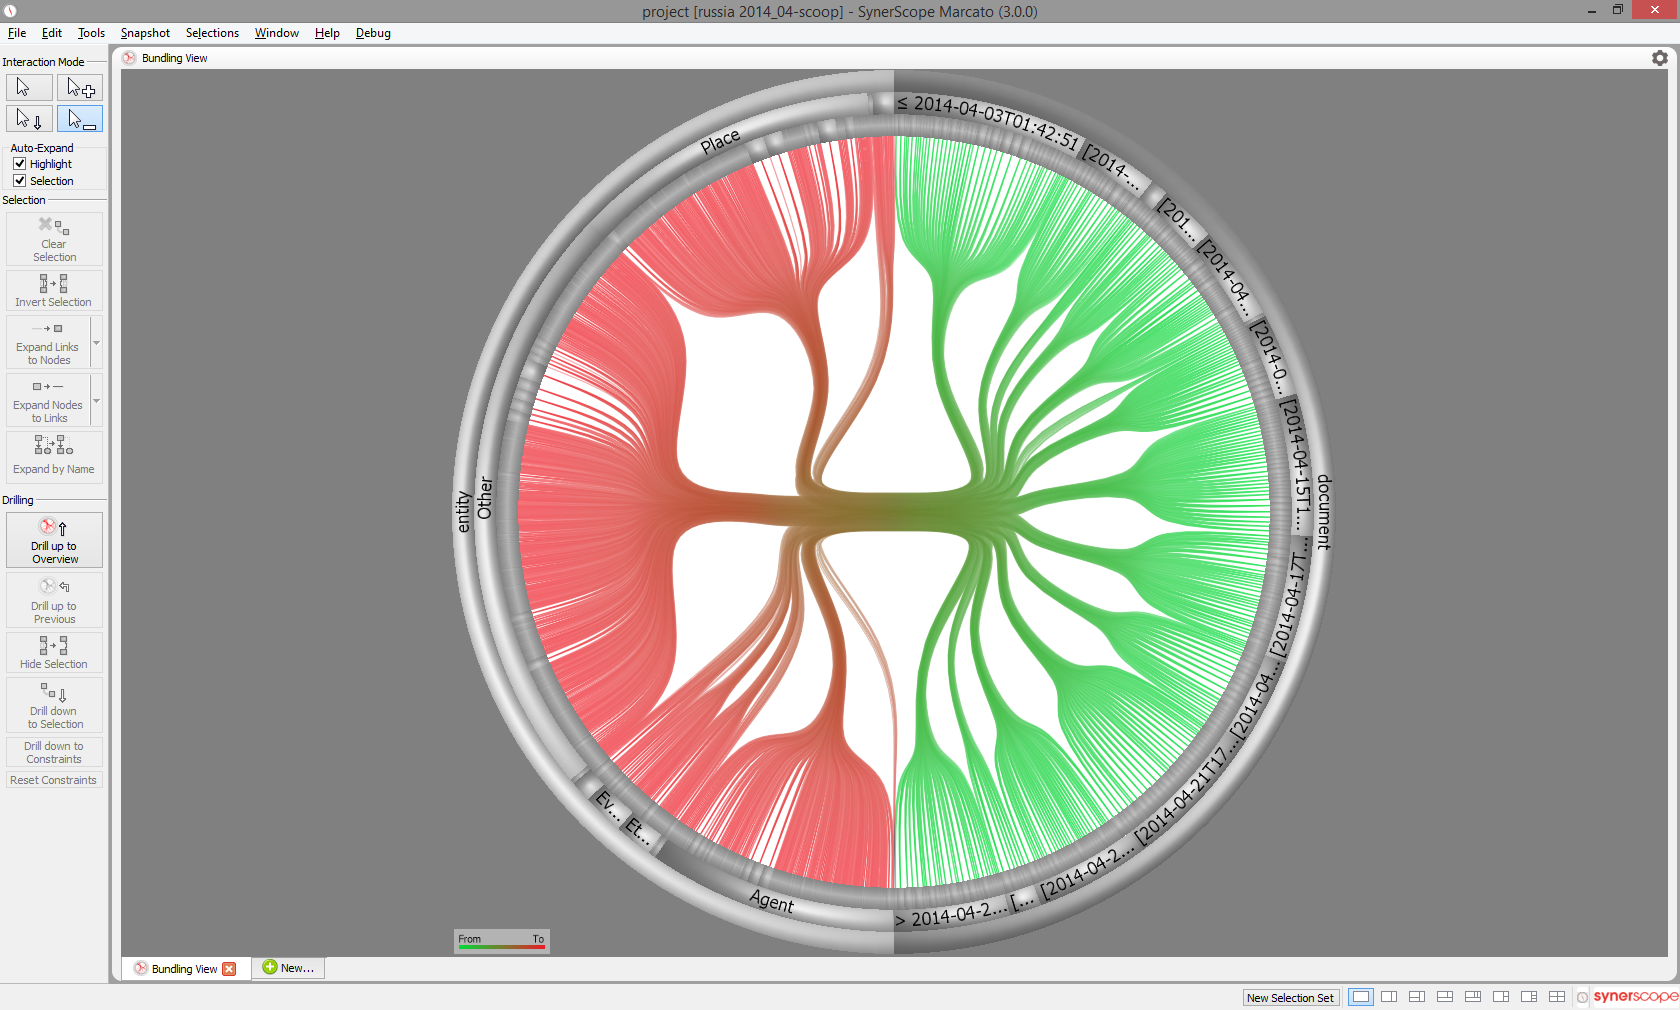
The network visualization shows which people and organizations are mentioned in the news, as well as why they were mentioned. You can also see which entities are mentioned together.
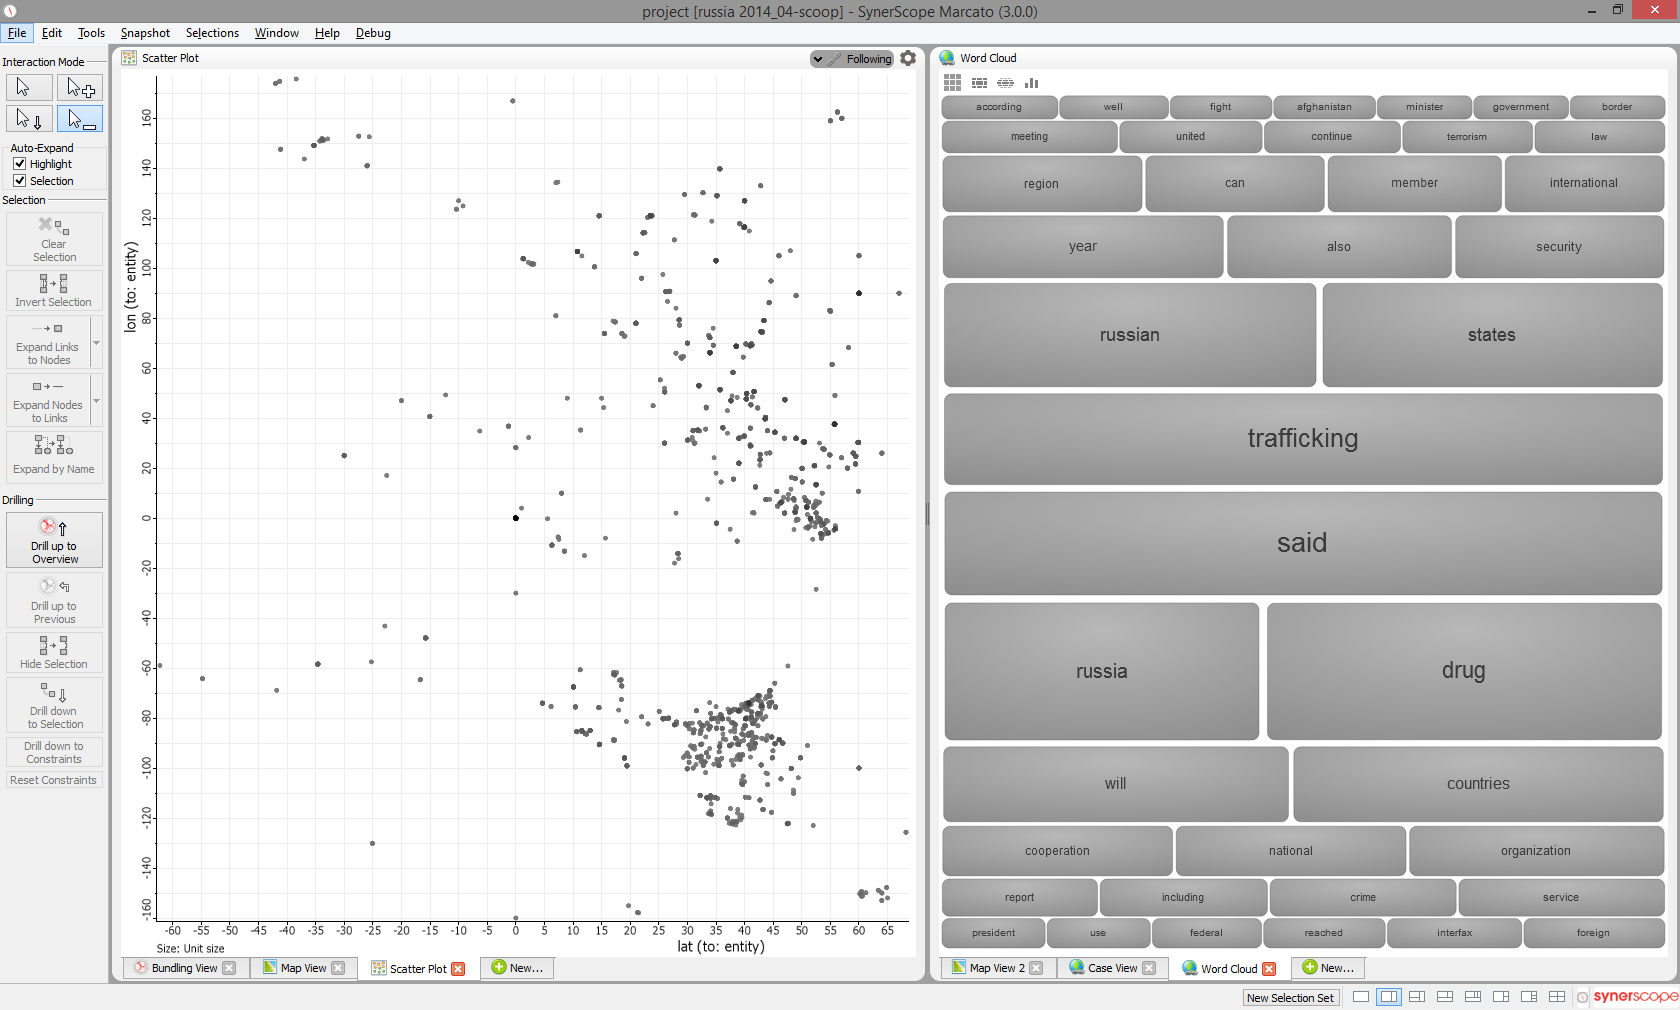
In addition to these three core visualizations, it is possible to show both structured and unstructured attributes in a scatter plot and word cloud visualization, respectively.
All these visualizations are shown simultaneously. If you highlight or select data items in one visualization, the equivalent highlight or selection is instantly applied to all other visualizations. This means that you can quickly identify correlations across dimensions.
SynerScope uses innovative visualizations to visually show the overall character of the data. The circular network view uses bundling technology to hierarchically group edges. This technique dramatically reduces visual clutter making it is easier to identify large groups of similar edges, but also to immediately see any edges that stand out from the rest. This is analogous to tie-wrapping or duct-taping cables together.
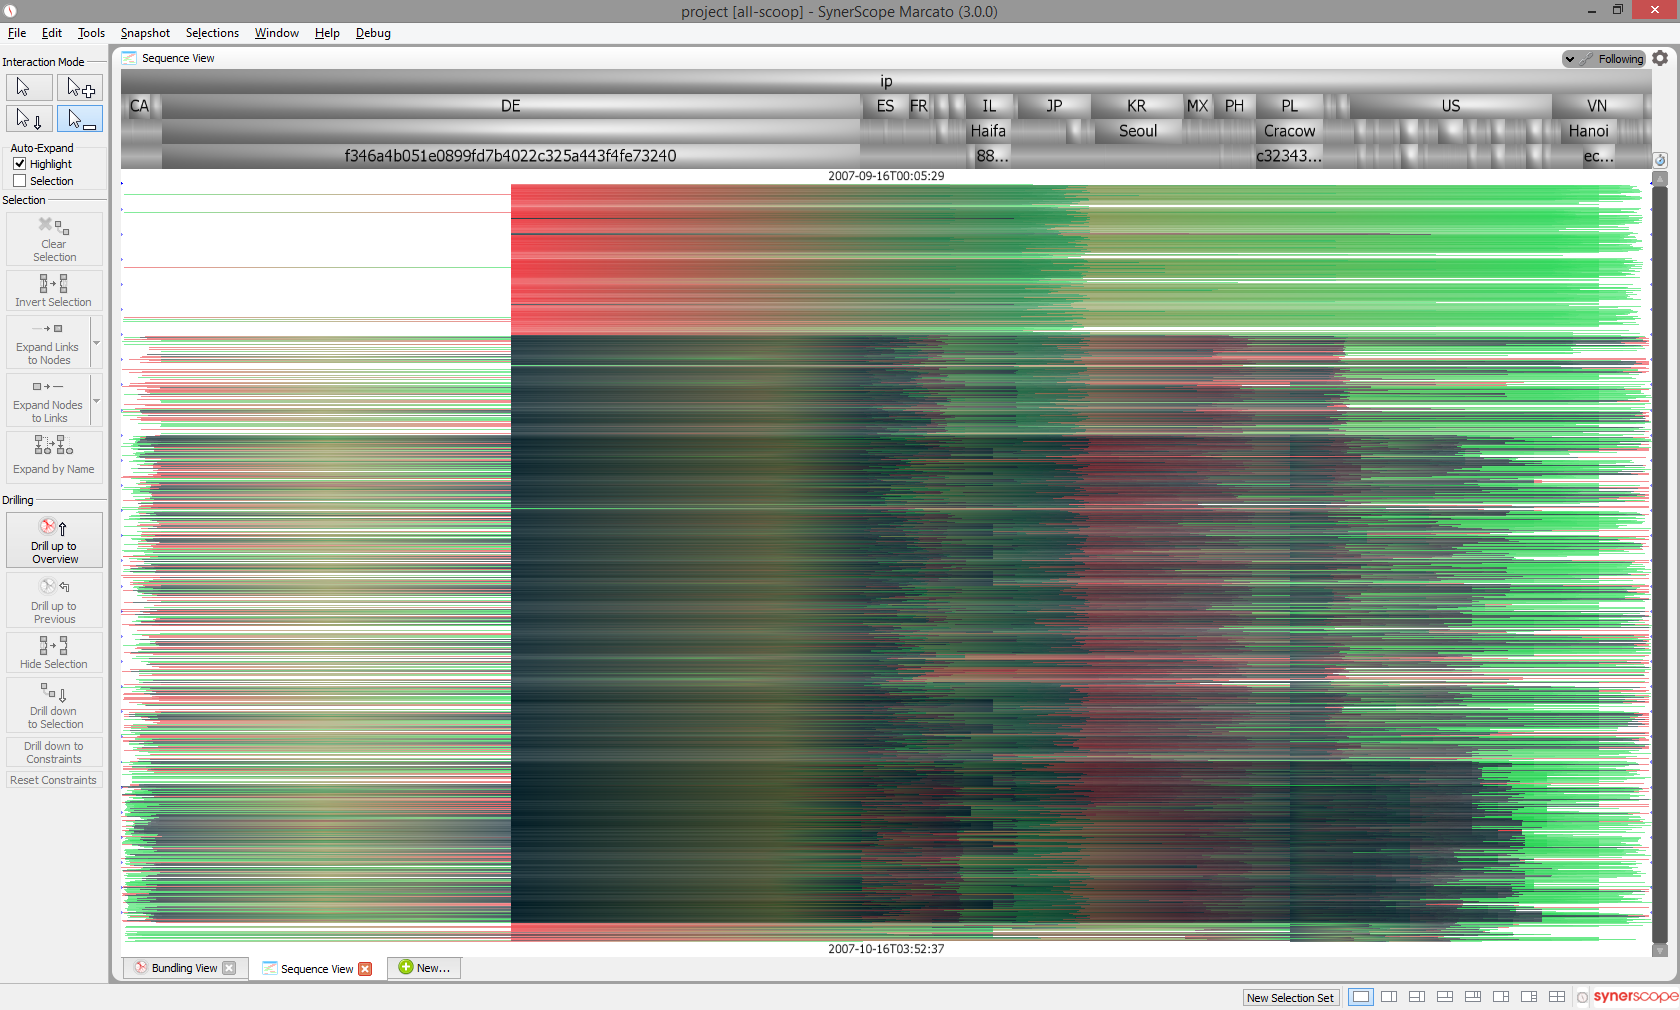
The timeline view is essentially a flattened version of the network view, ordered by time. Because no data is ever actually aggregated, each individual data point is always accessible and it is up to you drill down into any subset of data as you see fit. For example, if you only want to take a look at a particular time period, select it in the timeline and drill down. All visualizations will then automatically rescale to show the data you selected in more detail. At this time, a typical action is to select individual interesting data points, drill back up to all data and view that individual point in the context of the whole dataset.
Any user interaction (highlighting, selecting, drilling down or up) is extremely fast, even for large amounts of data. This means you do not lose your train of thought while you are exploring the data. To quickly render visualizations, SynerScope is driven by the same GPUs as used by gamers.
The automotive industry has a highly complex relationship network, as described in earlier blog posts by our consortium partners LexisNexis and VU University Amsterdam. Competitors can at the same time be partners, acquisition targets become buyers themselves, and brands change hands often. SynerScope can help people make sense of this complex network of events to gain a better understanding of what happened and why something happened. We envision that decision makers in similarly complex industries will take advantage of this knowledge to help them make future decisions with confidence.
If you want to join our automotive Hack Day then you can sign up for the Amsterdam event here or for our London event here.

